Approach 1-TateY & TylerR

Visualizing Extreme Possibilities of Gerrymandering
Summary:
We propose that by visualizing the extremes of gerrymandering we will create a country-wide conversation to address this unfair tactic in today’s polarized political environment.
Visuals:


Background:
Gerrymandering is the act of manipulating the boundaries of an electoral constituency or district, to favor a certain political party. We came to the conclusion that many citizens are not aware of the effects that gerrymandering has on elections. Even though our political system currently is extremely polarized, everyone can agree on the idea that our election system should be fair and just. The problem is there are a number of political tactics that are used to suppress voters and separate the power of certain voting communities which undermines the integrity of the election system – gerrymandering is one of those strategies. On average, only 60% of the eligible voting population turn out to vote at any given election. The tactic of gerrymandering undermines the voice of the people and their important votes. This project aims to help inform people around the country about this disruptive and important issue, create a conversation to solve this problem, and allow anyone to understand what gerrymandering is so they can join in the fight to make our election system more fair and just.
Explanation:
Our idea is to create a website that will help people understand the effects of gerrymandering by using interactive visuals. After searching the web, we found that it was tough to find a website that presented clear and concise information on the topic in an easily consumable way. We decided that visuals would be the most effective way to depict this information to the masses.
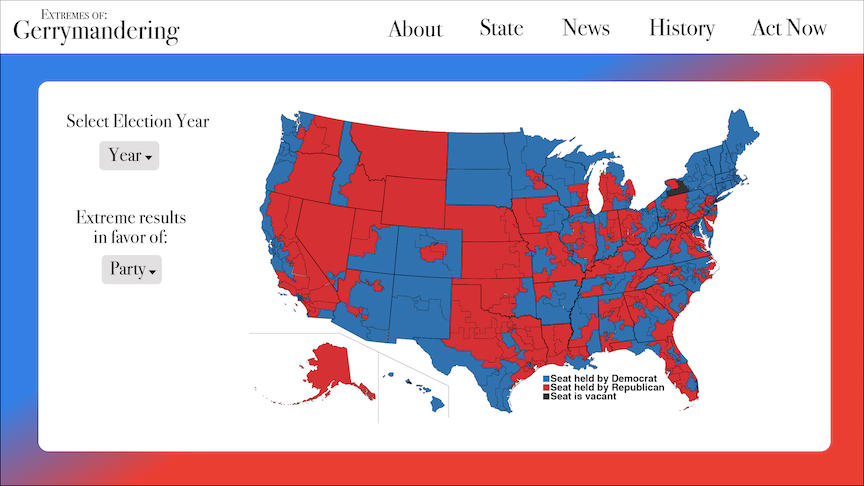
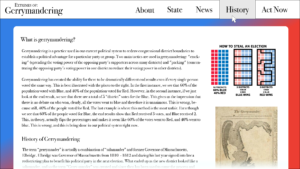
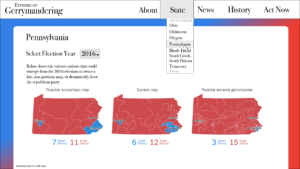
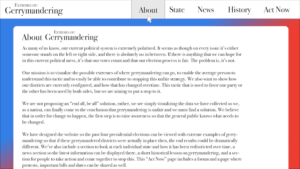
The website will be broken up into six sections. We have provided a few visual examples above for the sections such as Home (featured image to this post), History, About, and State. The following will give a brief explanation about each section:
Home Page – Being the first page that visitors will see, this page has a map of the entire United States and gives the visitor the option to select a certain election year, and then see what it could have looked liked if the gerrymandered states were set up to give an advantage towards a political party that they choose (Democrat or Republican). The front page visual will also give an accurate representation of what the current gerrymandered districts look like across the U.S. every election cycle so that users can view the dramatic changes that have taken place from voting year to voting year.
About Page – This page is all about our mission and why we have created this website. We want to be as transparent as possible, so this page is dedicated to allowing the viewers to view our goals in creating these visuals. It will also present the makers of the visuals and give appropriate credit where it is needed.
State – This page is dedicated to individualizing the information for each state so that anyone can see state district boundaries of the past and how they’ve changed, as well as see how extreme the redistricting could get it there was a goal to favor one party or the other.
News – The News section is self-explanatory. This will be a place where the website facilitator can update and add new articles and stories that are relevant to the topic of gerrymandering. This also could easily be just a display of a social media account and this could be run just by posting news and relevant pieces to the social media account.
History – One of the problems with the whole idea of gerrymandering is the fact that it can be very convoluted. Without a basic understanding of how it has happened over the years, it can seem like the way our districts are sorted out are fair – the problem is, our districts have changed dramatically since the beginning of gerrymandering and this is simply because our two main political parties have done everything they can to “crack” and “pack” the voting population. This page will attempt to show the larger events of gerrymandering and explain how our boundaries have ended up with where they are today.
Act Now – One of the most important steps in creating a solution is to show that the average person can and should get involved in finding that solution. The “Act Now” section will have tools and resources for anyone to get involved in the fight to end unfair redistricting, and display important bills being proposed, vote days, marches, and protests – encouraging anyone who is upset about this unfair political tactic to join in and act now.
Rough Budget:
Team of 3 – Data collecting and compiling. 40 hrs/week for 4 weeks @18/hour each: $8,640
Web Developer – 40 hrs/week for 4 weeks @ 22$ an hour: $3,520
Domain Name – $10.00 / month
Total: $12,160 + $10/month for Domain
We understand that our budget is quite large for this, but we also know that if this was to be done and done correctly, it would take a great deal of effort and work to even find and compile the data from our past elections. We have estimated our budget based on legitimate wages and time estimates, and this will ultimately create a great website as a result.
Time:
Hiring process for Web Developer and Data Team: 3 weeks
Data research and compiling – 4 weeks
Website Development – 4 weeks
Promoting website – 2 weeks
Total: 13 weeks (about 3 months)
Credits:
Photos used in website mockups from:
https://commons.wikimedia.org/wiki/File:US_Congressional_Districts,_party_colors_2009_07_23.svg
https://commons.wikimedia.org/wiki/File:How_to_Steal_an_Election_-_Gerrymandering.svg
https://www.nytimes.com/interactive/2018/01/17/upshot/pennsylvania-gerrymandering.html
You must be logged in to post a comment.